 GeoData.NZ
SUB-ICE PLATELET LAYER
Type of resources
Available actions
Topics
Keywords
Contact for the resource
Provided by
Years
Update frequencies
status
-

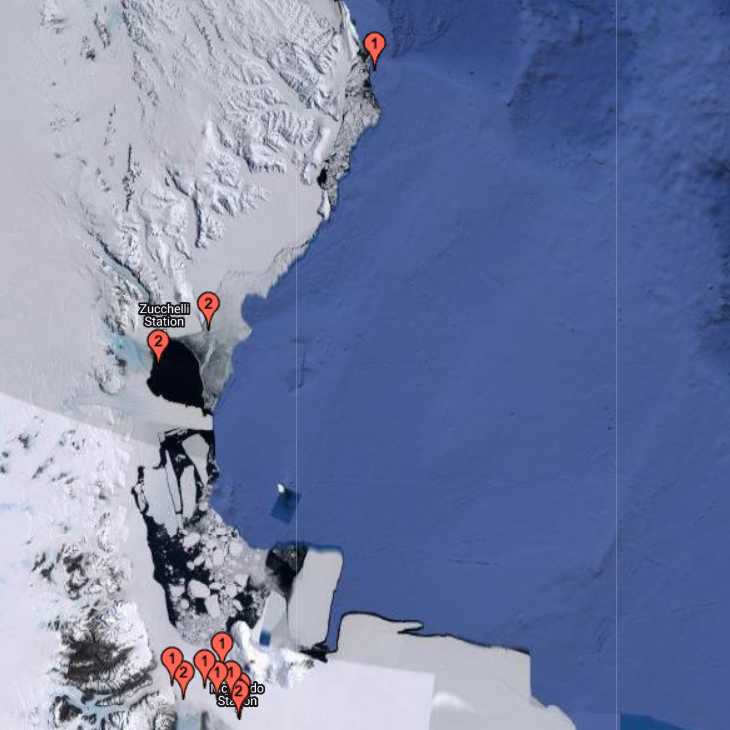
Here, we present drill hole measurements carried out at 14 field sites distributed over a ~1500 km^2 area of fast ice in the south of McMurdo Sound, Antarctica between 1 and 19 November 2018. At each site, five holes were drilled in the fast ice at the centre and end points of two cross‐profile lines, each 30 metre long. Sea ice and SIPL thicknesses were measured with a suspended thickness probe and metal bar using the procedure described in Price et al. (2014). Snow depth measurements at centimetre accuracy were made at half‐metre intervals along the cross‐profiles using a metal ruler or a GPS‐equipped Magnaprobe. Sea ice freeboard (i.e., the height of the sea ice surface above sea level) was measured in each of the drill holes. The average value for each parameter was calculated at each field site to provide a representative measurement over the 30 metre cross-profile fast ice area. The drill hole measurements were used to underpin spatial distribution surveys of the aforementioned parameters, to inform electromagnetic induction forward and inverse models, and to ground-validate satellite altimetry assessments of fast ice freeboard and derived ice thickness in McMurdo Sound.
-

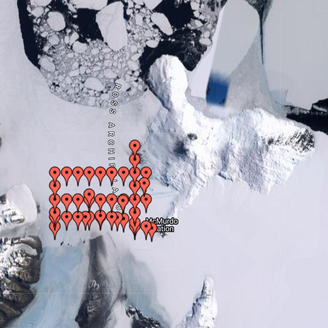
The thicknesses of sea ice and sub-ice platelet layer were measured at regular intervals on fast ice in McMurdo Sound, Antarctica in November of 2017. Thirty-metre cross-profiles were established at each site, and snow depths were measured at 0.5 m intervals along the transect lines with a MagnaProbe. A mean snow depth for each site was derived from these 120 measurements. Freeboard, sea ice thickness and sub-ice platelet layer thickness were recorded at five locations at each site - at the central crossing point and at the end points of each transect. The mean of these was then calculated and taken as representative of the site. Ice thicknesses were measured by using a tape measure with a brass T-anchor attached at the zero mark. This was deployed vertically through the drill-hole and allowed to rotate to a horizontal alignment when exiting the bottom of the drill-hole at the ice-ocean interface. From this position the anchor is slowly pulled upwards until some resistance is met and the first measurement is taken. This resistance is taken to mark the sub-ice platelet layer/ocean interface. The tape measure is then pulled harder, forcing the bar to pass through the sub-ice platelet layer until it sits flush against the sea ice/sub-ice platelet layer interface where a second measurement is taken. Measurement sites were about 10 km apart.
-

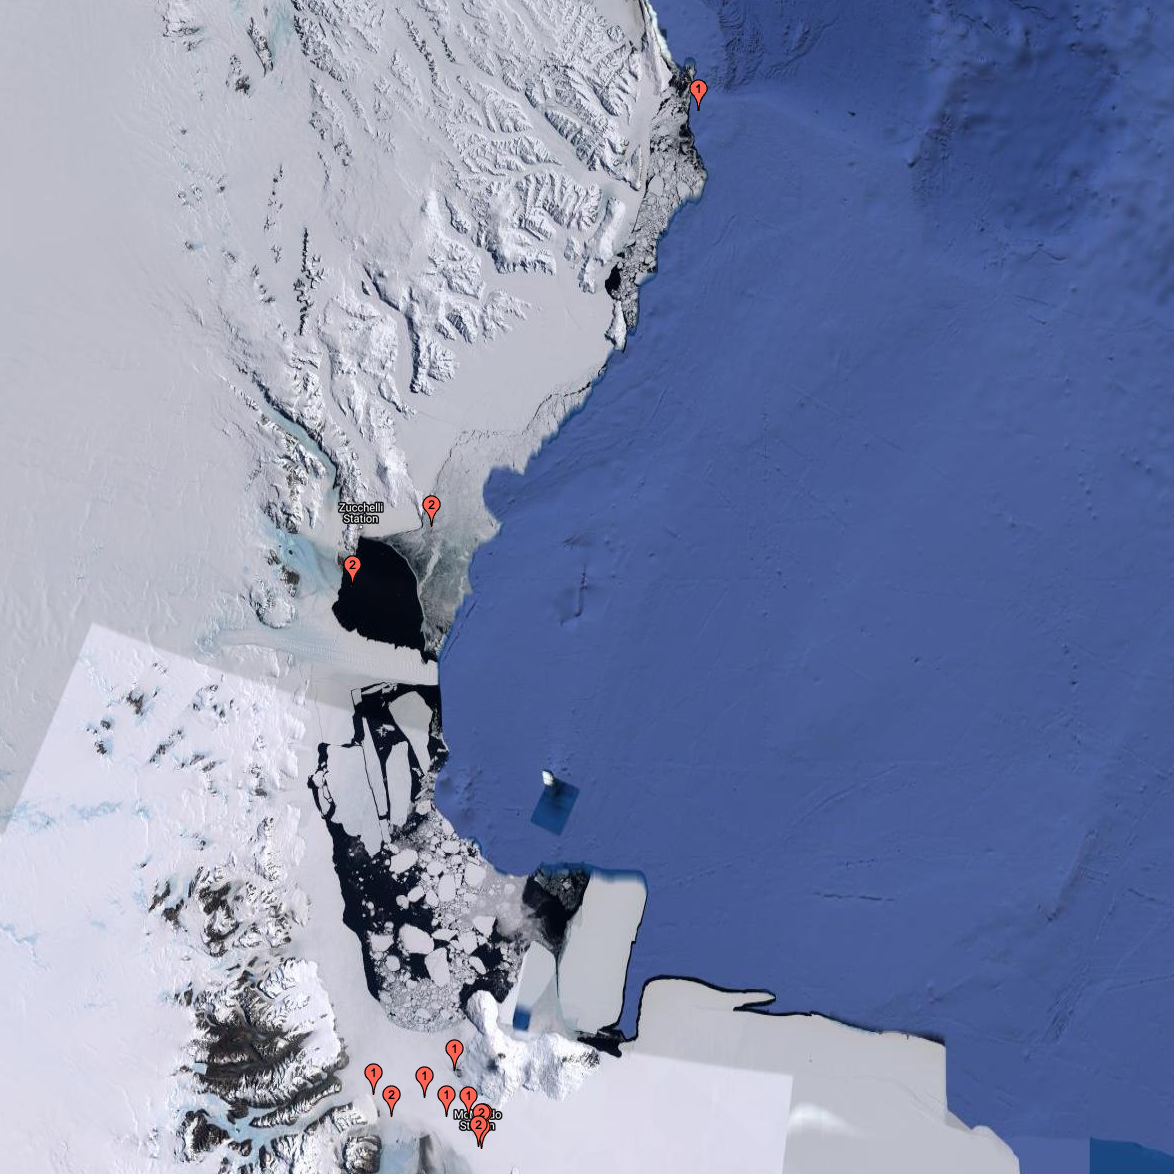
The thicknesses of sea ice and sub-ice platelet layer were measured at regular intervals on fast ice in McMurdo Sound, Antarctica in November of 2016. Thirty-metre cross-profiles were established at each site, and snow depths were measured at 0.5 m intervals along the transect lines with a MagnaProbe. A mean snow depth for each site was derived from these 120 measurements. Freeboard, sea ice thickness and sub-ice platelet layer thickness were recorded at five locations at each site - at the central crossing point and at the end points of each transect. The mean of these was then calculated and taken as representative of the site. Ice thicknesses were measured by using a tape measure with a brass T-anchor attached at the zero mark. This was deployed vertically through the drill-hole and allowed to rotate to a horizontal alignment when exiting the bottom of the drill-hole at the ice-ocean interface. From this position the anchor is slowly pulled upwards until some resistance is met and the first measurement is taken. This resistance is taken to mark the sub-ice platelet layer/ocean interface. The tape measure is then pulled harder, forcing the bar to pass through the sub-ice platelet layer until it sits flush against the sea ice/sub-ice platelet layer interface where a second measurement is taken. Measurement sites were about 10 km apart.
-
Data of apparent ice thickness from airborne electromagnetic (AEM) surveys of fast ice in McMurdo Sound, Antarctica, carried out in Nov/Dec 2009, 2011, 2013, 2016, and 2017. Values are given for apparent thicknesses derived from both, in-phase and quadrature signals. The difference between both thicknesses is a scaled measure of sub-ice platelet layer thickness. Data are from east-west transects across McMurdo Sound, at fixed latitudes. Data were smoothed and interpolated onto a regular longitude grid (0.001 degree increments). More information can be found in: Haas, C., Langhorne, P. J., Rack, W., Leonard, G. H., Brett, G. M., Price, D., Beckers, J. F., and Gough, A. J.: Airborne mapping of the sub-ice platelet layer under fast ice in McMurdo Sound, Antarctica, The Cryosphere, 15, 247–264, https://doi.org/10.5194/tc-15-247-2021, 2021
-
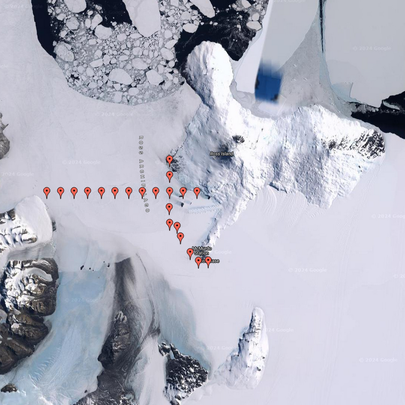
The thicknesses of sea ice and sub-ice platelet layer were measured at regular intervals on fast ice in McMurdo Sound, Antarctica in November and December of 2011. Thirty-metre cross-profiles were established at each site, and snow depths were measured at 0.5 m intervals along the transect lines with a metal ruler. A mean snow depth for each site was derived from these 120 measurements. Freeboard, sea ice thickness and sub-ice platelet layer thickness were recorded at five locations at each site - at the central crossing point and at the end points of each transect. The mean of these was then calculated and taken as representative of the site. Ice thicknesses were measured by using a tape measure with a brass T-anchor attached at the zero mark. This was deployed vertically through the drill-hole and allowed to rotate to a horizontal alignment when exiting the bottom of the drill-hole at the ice-ocean interface. From this position the anchor is slowly pulled upwards until some resistance is met and the first measurement is taken. This resistance is taken to mark the sub-ice platelet layer/ocean interface. The tape measure is then pulled harder, forcing the bar to pass through the sub-ice platelet layer until it sits flush against the sea ice/sub-ice platelet layer interface where a second measurement is taken. Measurement sites were about 5 km apart.
-
Data of apparent ice thickness from airborne electromagnetic (AEM) surveys of fast ice in McMurdo Sound, Antarctica, carried out in Nov/Dec 2009, 2011, 2013, 2016, and 2017. Values are given for apparent thicknesses derived from both, in-phase and quadrature signals. The difference between both thicknesses is a scaled measure of sub-ice platelet layer thickness. Data are from east-west transects across McMurdo Sound, at fixed latitudes. Data were smoothed and interpolated onto a regular longitude grid (0.001 degree increments). More information can be found in Haas et al. (2021). Related Publication: Haas, C., Langhorne, P. J., Rack, W., Leonard, G. H., Brett, G. M., Price, D., Beckers, J. F., and Gough, A. J.: Airborne mapping of the sub-ice platelet layer under fast ice in McMurdo Sound, Antarctica, The Cryosphere, 15, 247–264, https://doi.org/10.5194/tc-15-247-2021, 2021
-
Sea ice thickness and sub-ice platelet layer thickness under sea ice was measured in regular intervals. Holes were drilled into sea ice at measurement sites about 5 km apart. The thickness was measured using measurement tapes. Snow depth on sea ice was also measured at sites.